“Organic”, “All-Natural”, and “Locally Produced” are all great initiatives in the momentum of sustainable food and agriculture, but they will all remain buzz words unless standards are set in place. These standards are currently out of reach due to the lack of transparency within the industry. Right now, there seems to be a deliberate veil between us and where our food comes from, rendering us powerless. We need an ideal label not from the perspective of marketers, but from consumers.
Current Laws and Regulations:
We are proposing this policy memo that aims to establish a transparent labeling system for all food products beginning with raw fruits, vegetables, and fish. Currently, food labeling for raw products are not required within Providence and the United States. According to Chapter 1 Sec. 101.45 of the FDA guidelines, nutrition labeling of raw fruits, vegetables, and fish are voluntary. No other kind of labeling is mentioned nor required. Food safety relies on the FDA's importation laws and local production laws, which are harder to trace and therefore traditionally have not been transparent either.
U.S. Government intervention in labeling began in 1906 with the Federal Pure Food and Drugs Act and the Federal Meat Inspection Act, which authorized Federal regulation of the safety and quality of food and prohibited sales of misbranded or adulterated foods. Lawmakers’ primary objective in passing the acts’ labeling regulations was to enhance fair competition by cracking down on deceptive marketing practices. Enhancing fair competition and market efficiency has remained the primary motivation behind food labeling regulation for the past 100 years.
Current Problems:
The current law only mentions voluntary labeling or health- and nutrition-related (HNR) claims which are most often "Low Fat", "Sodium Free", "Organic", "All-Natural", and "Locally Produced". Since they are voluntary however, these are not held to stringent standards. This kind of labeling just leads to consumer confusion. Companies that produce food that is anything but natural can use loopholes and vague language in current laws to label their food as natural.
Even within the required packaged food labeling, there are issues regarding transparency. Ingredients are all placed under an umbrella. If a product is using corn, it does not matter what type of corn it is.
One snapshot of this crisis is the debate over GMO products. Unlike strict safety evaluations required for the approval of new drugs, the safety of genetically engineered foods for human consumption is not adequately tested. Drugs are also labeled with possible side effects, which certain types of food has on the human body as well. As seen from a public health point of view, this lack of transparency in Providence can lead to an untraceable epidemic that can have sever adverse effects on sustainability. More than 60 countries including the EU, Japan and China already label GMO products.
This kind of lack of control and limited labeling is a sustainability problem. Our current "normal" agricultural industrial model that we rely on and its distribution has a lot of negative impacts on all sectors of sustainability including environment, equity, and economy. Lack of food sourcing transparency leads to nutritional issues and foodborne-illnesses but most importantly it creates an inefficient distribution of power through manipulation. Empowerment and choice are stifled when there is a lack of transparency.

Figure 1.1 Map with Farmers’ Markets, Grocery Retail Locations (2013) and Low Income and Low Access Tracts, as of 2010

Figure 1.2 Map with Farmers’ Markets, Grocery Retail Locations (2013) and Estimated percent of adults reporting to be obese (a body mass index of 30 or greater) in 2013.
As seen with Figure 1.1, location of farmers markets and grocery retail locations are abundant. Yet, there is still a lack of access to food especially for low income groups. The next map Figure 1.2 shows us that there is a moderately high case load of adults reporting to be obese (BMI of 30 or greater). There also seems to be a correlation between lower obesity and the proximity of a farmers market. One cause of this health issue is lack of both access to nutritional food and proper food education.

Figure 2.1 Food at home ($000), 2015 by Census Tracts of Providence
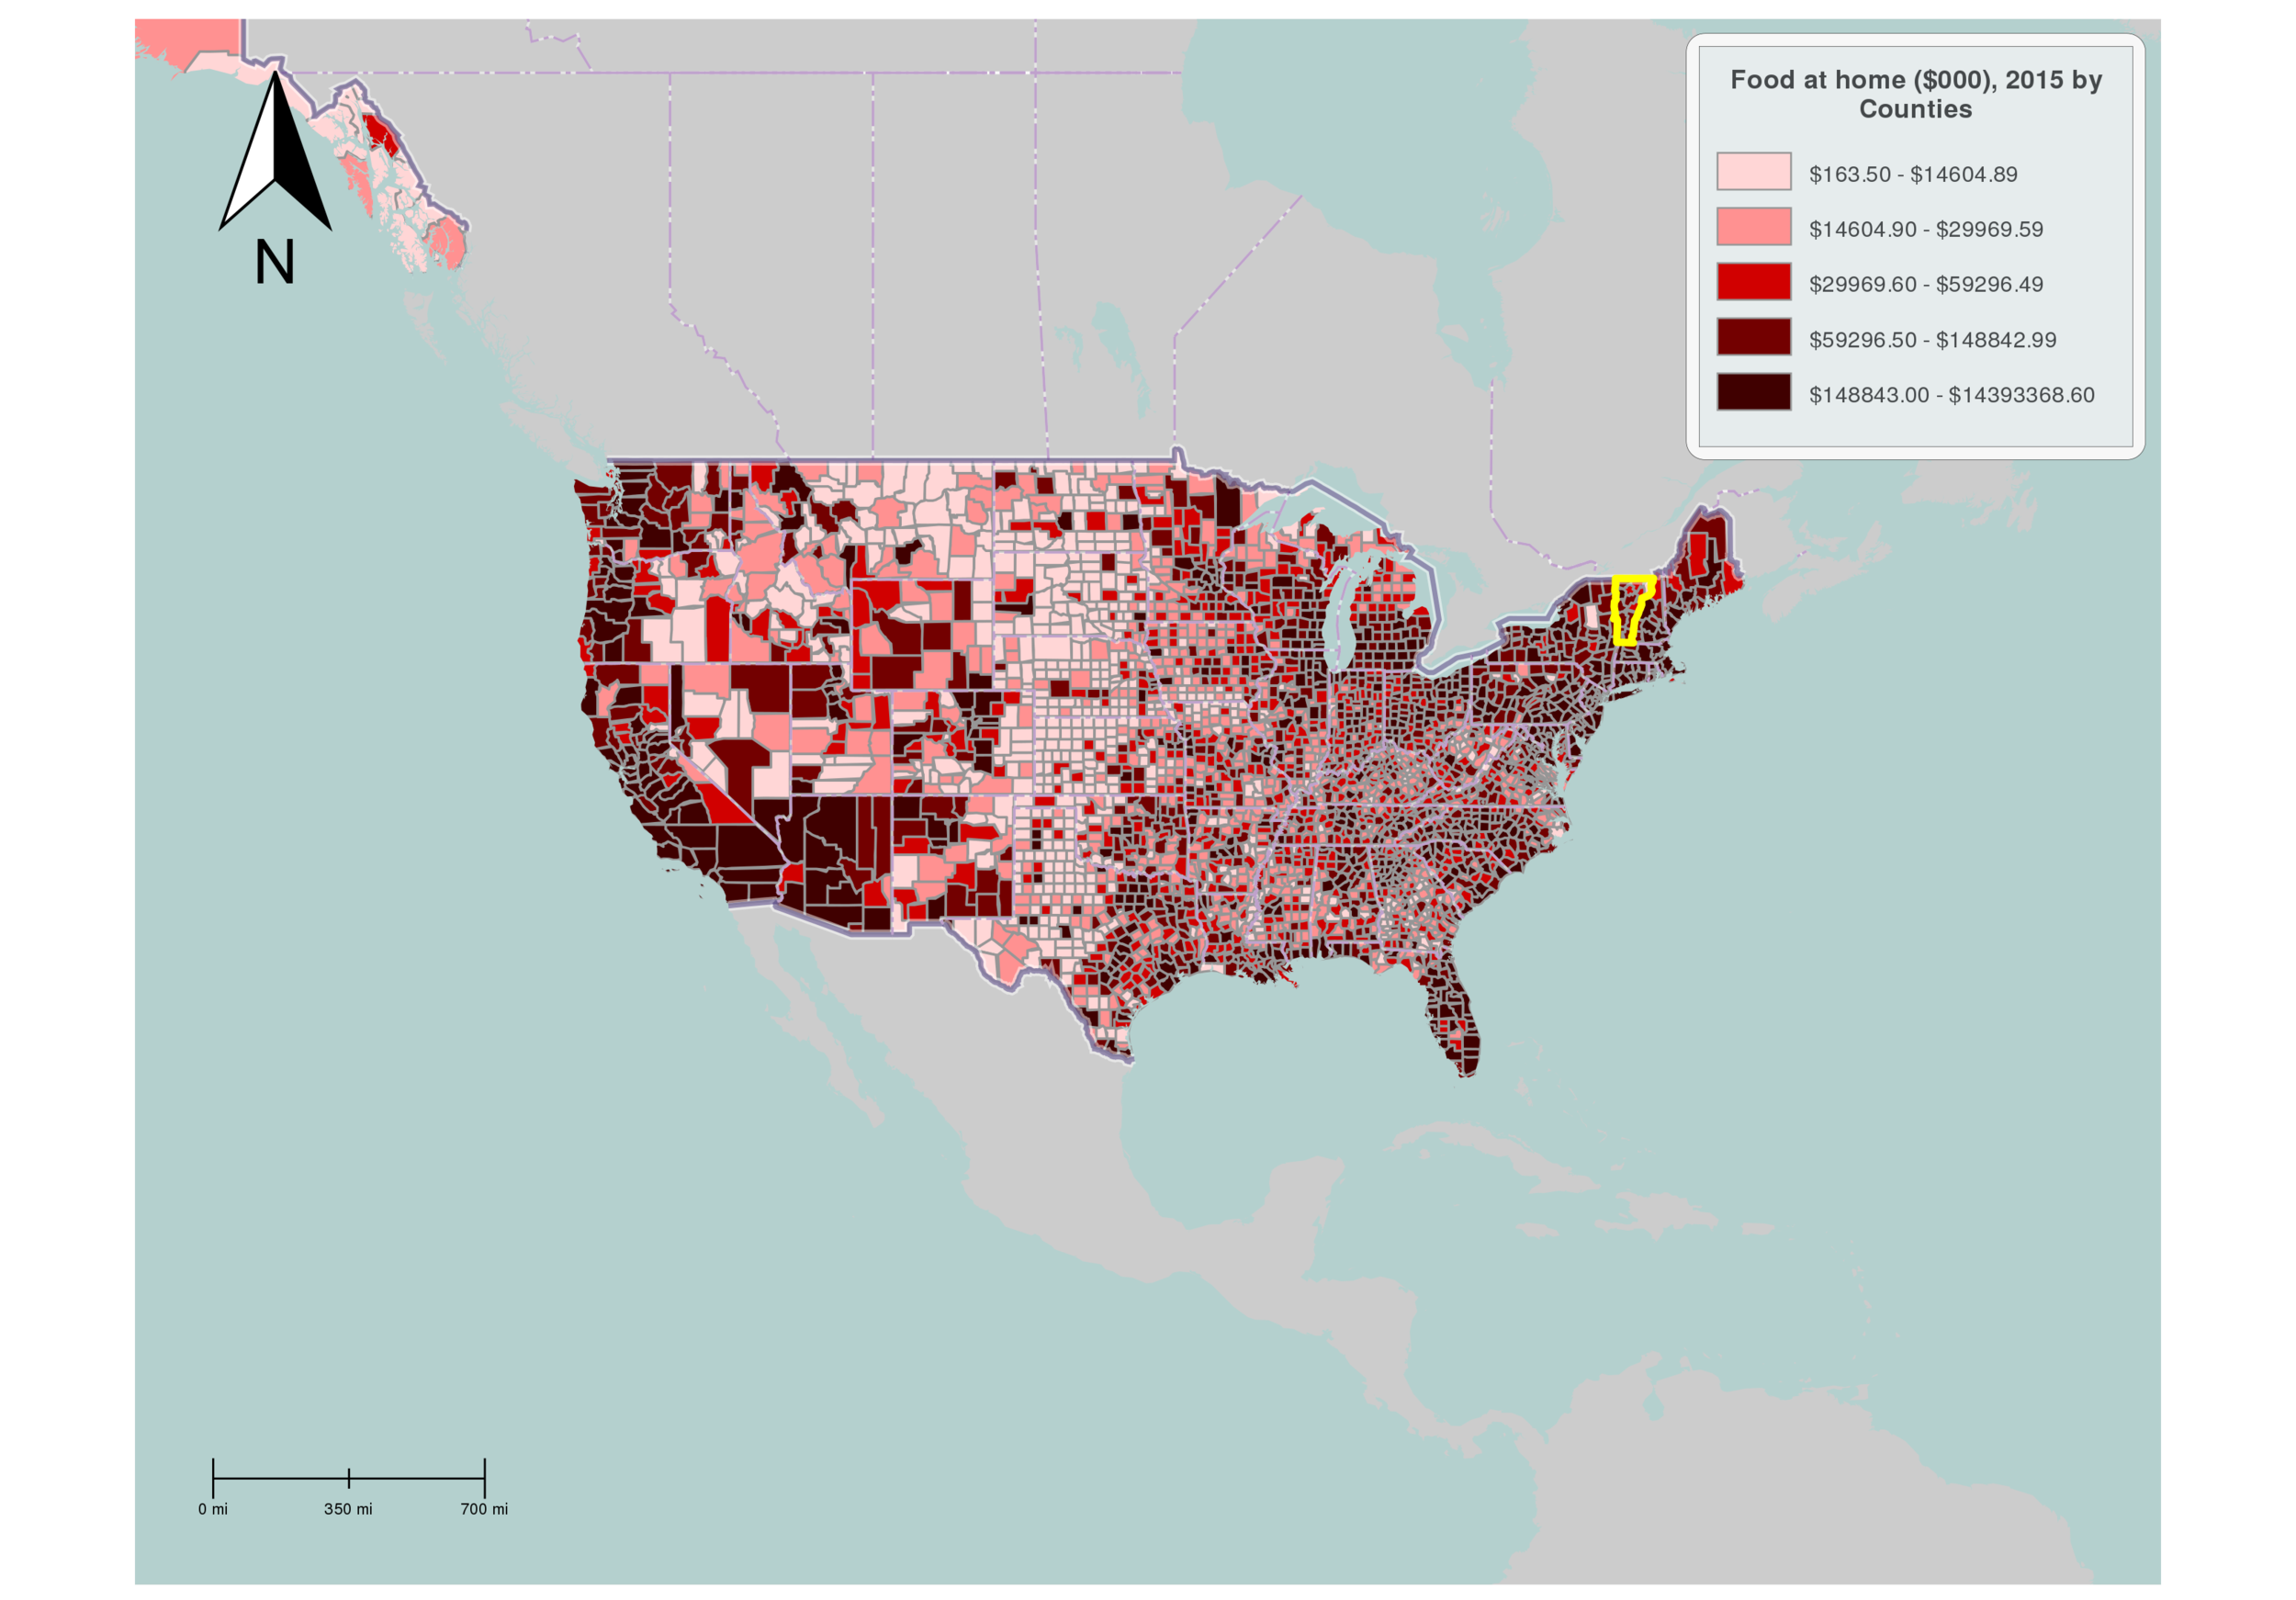
Figure 2.2 Food at home ($000), 2015 by Census Tracts of United States
According to Figure 2.1, citizens in Providence pay an average of $5,797 per year for food at home. This is very high when compared to the American average of $2,273 per year for food at home according to the USDA. As seen in Figure 2.2, expenditure for food is much lower in central America, where food production is higher. Cost is decreased due to transportation and processing.

Figure 3.1 Map with Estimated percent of people age 16 years or older who were employed in Agriculture, Forestry, Fishing and Hunting Industry between 2009-2013
Currently as seen with Figure 3.1, percent of agriculture, forestry, fishing and hunting industry is quite small compared to other industries within Providence. This showcases the lack of local production of food, which is correlated to higher food prices and lack of access.
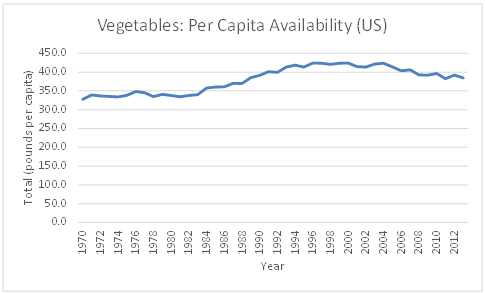
Figure 4.1 Trend of Vegetables: Per Capita Availability in the US
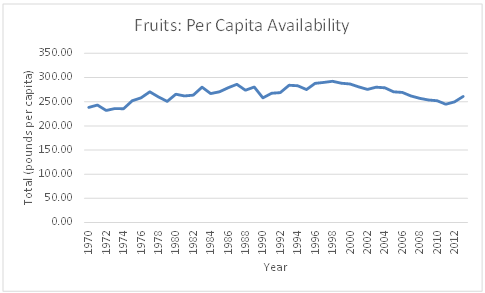
Figure 4.2 Trend of Fruits: Per Capita Availability in the US
This lack of access is not only a Providence issue but a nationwide one as well, according to information provided by the USDA. As seen in Figure 4.1 there is a clear decrease in vegetable availability in the US. Fruits on the other hand has been more stable but also shows dips in availability according to Figure 4.2.
Policy Memo:
This new policy memo provides all the necessary information to completely inform the consumer and aid their choices. The information provided will include but is not limited to:
- Type of Seed Used (GMO or not)
- Type of Fertilizer Used
- Location of Farm
- Location of Processing
- Type of Processing
- Additives Used
- Date of Planting
- Date of Harvest
- Recommended Shelf Life
Alongside the aforementioned information, food will also be required to include a "stoplight" label that is based on a standardized 15-point scale. The color of the product will be determined by where it falls in this scale: 0 to 5 is red, 6 to 10 is yellow, and 11 to 15 is green. The scale is based on three key factors including nutrition and health benefits, how close the product is to real food, and production. The last metric involves quality of treatment of workers, animals, and the earth. According to a study done by the American Journal of Public Health, sales of red-lighted soda fell by 16.5% in only three months of implementation.
One factor of a successful memo is its scalability. This labeling system can be applied to all different sectors of the industry and start with a few products first. For the test pilot, this label will be first applied to apples in Providence supermarkets. Once successful, it can trickle down to all other raw food and even packaged food.
Supermarkets were chosen as the initial target because most of the parties involved in the food system converge here in where food is collected, distributed, and consumers vote with their dollars. Without transparent food systems, accountability is impossible, and the industry will be continuously motivated by inefficient market forces. By providing more information, consumers are able to make decisions that are based on facts rather than in marketing.
Impact:
This policy memo tackles the issue in where most impact can be made, by changing market forces through educating the public and increasing access. By improving access to healthy produce, Providence could reduce rates of nutrition-related disease, like diabetes and heart disease. Since many diseases are caused by - or at the very least, correlated with - poverty, improving access to healthy food for low-income communities in Providence leads to a healthier city overall.
According to a study done by the Economic Research Service as seen with Figure 5.1, a large amount of people surveyed would use nutrition information in fast-food/pizza place in deciding what to order.

Figure 5.1 Survey of Who Would Use Nutrition Information in Full-Service Restaurants in Deciding What to Order
As seen with Figure 5.2, availability of labels and guidelines have proved to be effective in affecting consumer choice. In a study conducted by the USDA, the whole-grain industry grew significantly when the 2005 dietary guidelines were released. This further supports the need for a new kind of transparent label.

Figure 5.2 Trend on Whole-Grain Product Introduction by Manufacturers
Aside from health, this policy memo improves all sectors of sustainability. Environmentally, local food is better because it decreases transportation, processing, and shipping costs. Reversing industrial agriculture into a more ecological practice would decrease carbon emission, water run-off, and increase soil productivity. Economically, local food is cheaper and stimulates the local economy. It gives the state more financial independence and more resilient over nationwide financial fluctuations. With regard to equity, the information provided will highlight local farming and more ecological agricultural practices that are more beneficial to health. This would increase local food production. When food is sourced locally, it becomes more affordable and thus more accessible for more people. It also provides more jobs within the region.
The attached figures shown are just a few of the metrics that can gauge the success of this policy memo. With our current data, there is a clear need for this policy but it can have many more positive externalities. It has the ability to really impact and improve lives through creating a sustainable environment that enables smarter growth.
Sources:
"A 2-Phase Labeling and Choice Architecture Intervention to Improve Healthy Food and Beverage Choices." American Public Health Association -. Accessed October 22, 2015.
Law, Alex. "The DARK Act Makes Absolutely No Sense, And Here's Why." The Huffington Post. Accessed October 22, 2015.
"Food Policy: Check the List of Ingredients." USDA ERS -. Accessed October 22, 2015.
Gregory, C., T.A. Smith, and M. Wendt. 2011. How Americans Rate Their Diet Quality: An Increasingly Realistic Perspective. U.S. Department of Agriculture, Economic Research Service, EIB-83, September.
Kim, S.Y., R.M. Nayga, and O. Capps. 2001. “Food Label Use, Self-Selectivity, and Diet Quality,” Journal of Consumer Affairs 35(2):346-63.
"Obesity and Other Health Concerns Lead Food Companies to Step up Health and Nutrient Claims." USDA ERS -. Accessed October 22, 2015.
"USDA ERS - Food Expenditures." USDA ERS - Food Expenditures. Accessed October 22, 2015.
Seiders, K., and R.D. Petty. 2004. “Obesity and the Role of Food Marketing: A Policy Analysis of Issues and Remedies,” Journal of Public Policy & Marketing 23(2):153-69.